Using SDE and VTUNE to calculate performance data
NERSC has extensive documentation and examples for collecting Arithmetic Intensity (AI) and FLOPs using the Intel SDE and VTune tools. You can find instructions for this here.
Using Vector Advisor to automate roofline data collection
In addition to VTune and SDE, Intel provides a useful tool exploring performance of an application against expectations called Intel Vector Advisor. The tool can automate the collection and presentation of roofline model data. The following guide describes how this is done:
Compiling
-
Compile code with the -g flag.
-
Optimizations flags can (and should) be included.
-
Using the -dynamic flag for dynamic linking is recommended.
Running
-
We recommend running applications using the command line interface advixe-cl.
-
To access the binaries, load the advisor module using module load advisor.
-
Always run vector advisor out of the Lustre filesystems at NERSC and ALCF. Runs out of GPFS filesystems are known to fail.
-
Since version 2017/update 2 the roofline is a standard feature and does not require setting any additional environment variables.
-
To collect roofline data, Advisor needs to do two collection runs, survey and tripcounts. Survey is a quick pass with no noticeable overhead that is used to count the application run time. Tripcounts has significant overhead.
srun <srun options> advixe-cl -collect survey -project-dir <same data directory> -- <executable>
srun <srun options> advixe-cl -collect tripcounts -flops-and-masks -project-dir <same data directory> -- <executable>
There are a number of additional flags that can be used to speed up the collection including
-no-stack-stitching and
-no-auto-finalize which can be used to skip the expensive data finalization step. This is recommended on KNL systems where the cores of the compute nodes are less
powerful than the cores of the login nodes. When the results are opened in the GUI, they will be finalized on the node running the GUI.
Using the GUI
-
Load advisor using module load advisor.
-
Open the GUI with advixe-gui
The GUI opens to the welcome screen. Click on open result and navigate to the data directory you gave to advixe-cl
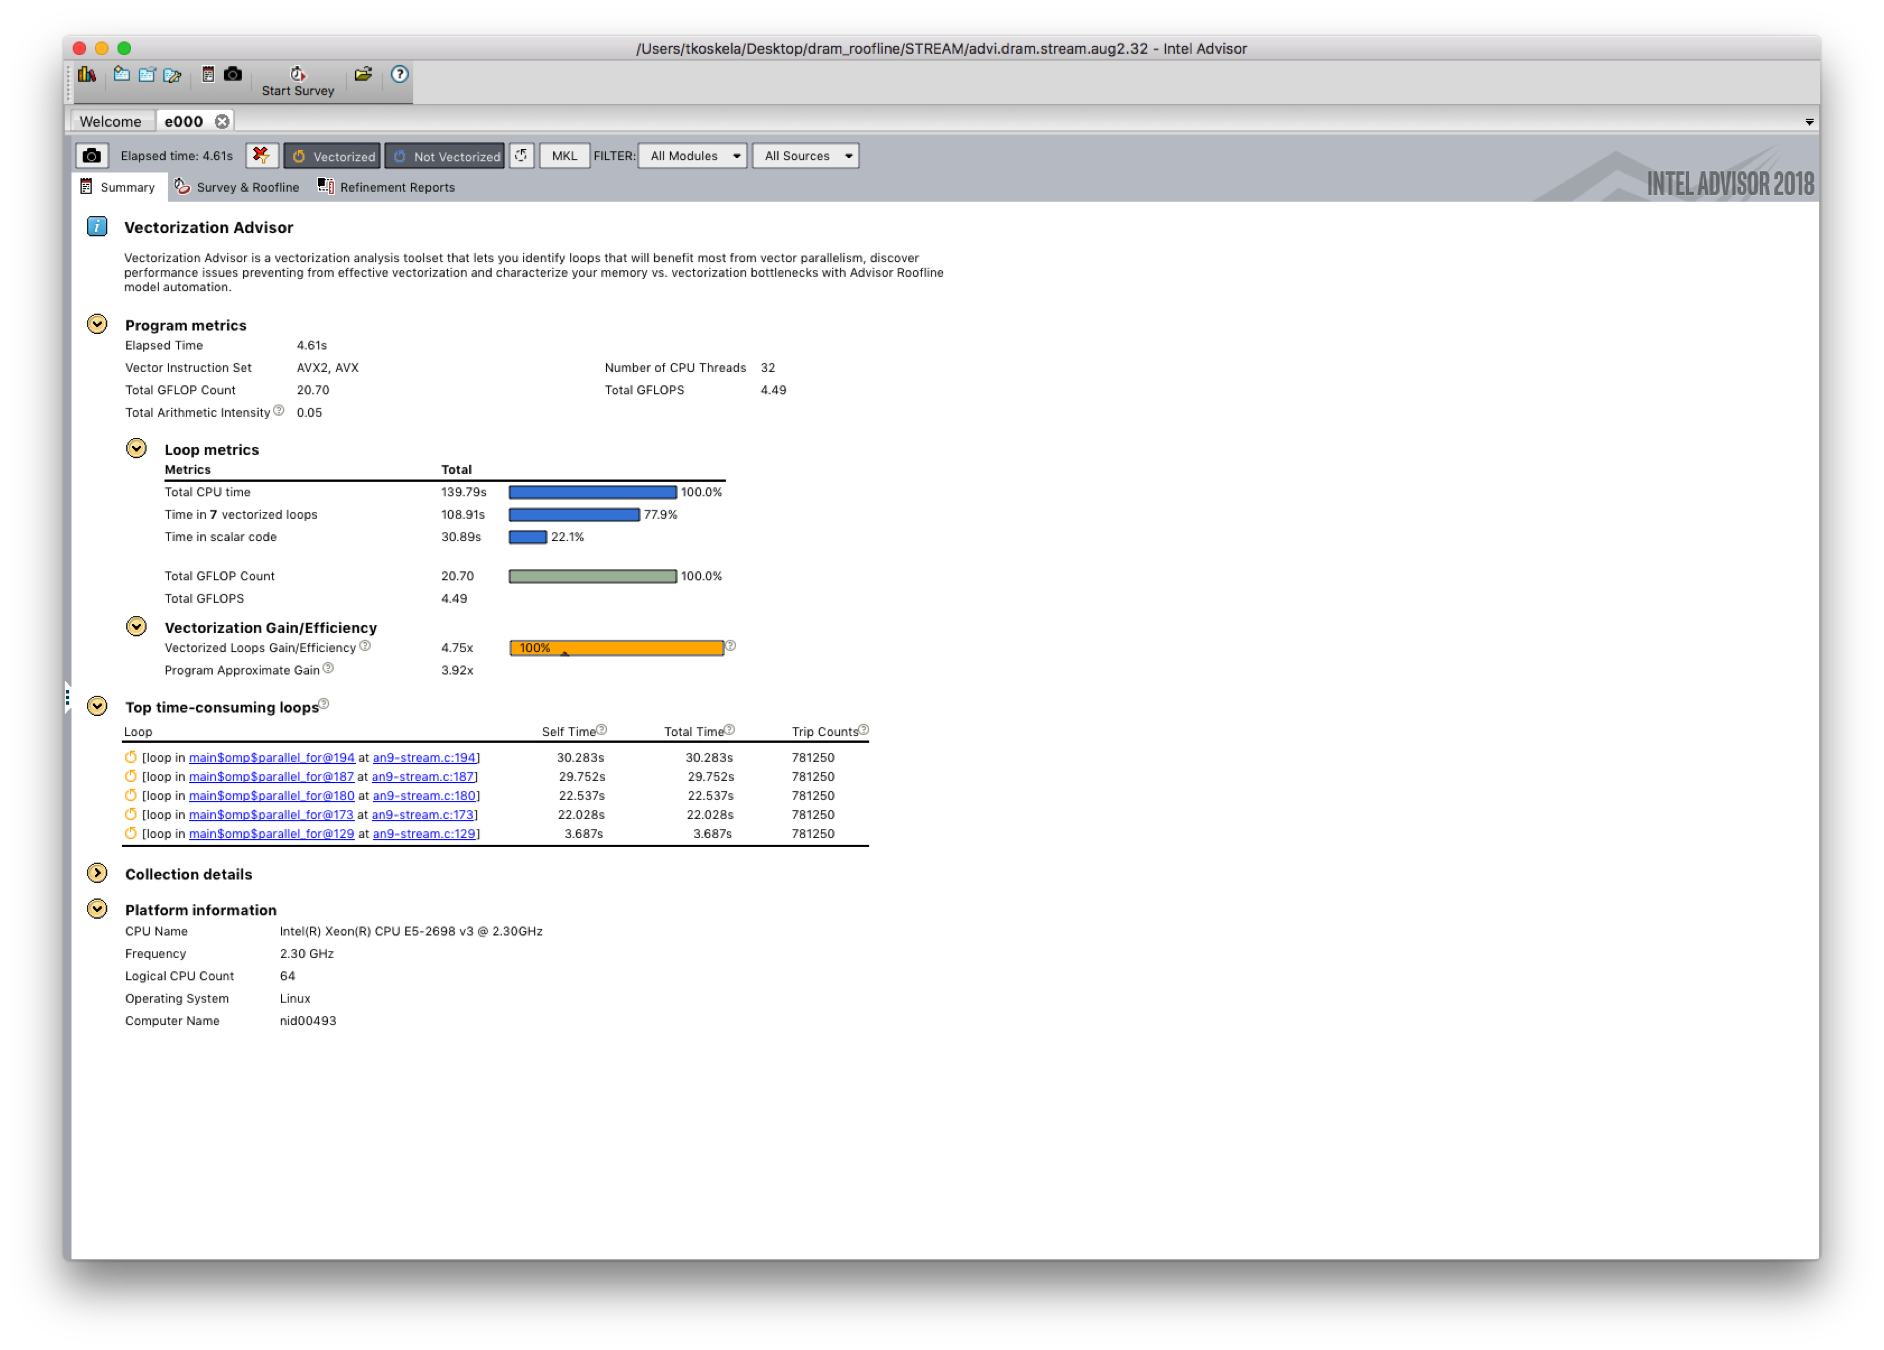
A new result opens to the summary page. This page gives useful overall metrics for the application and highlights the top five time-consuming loops.
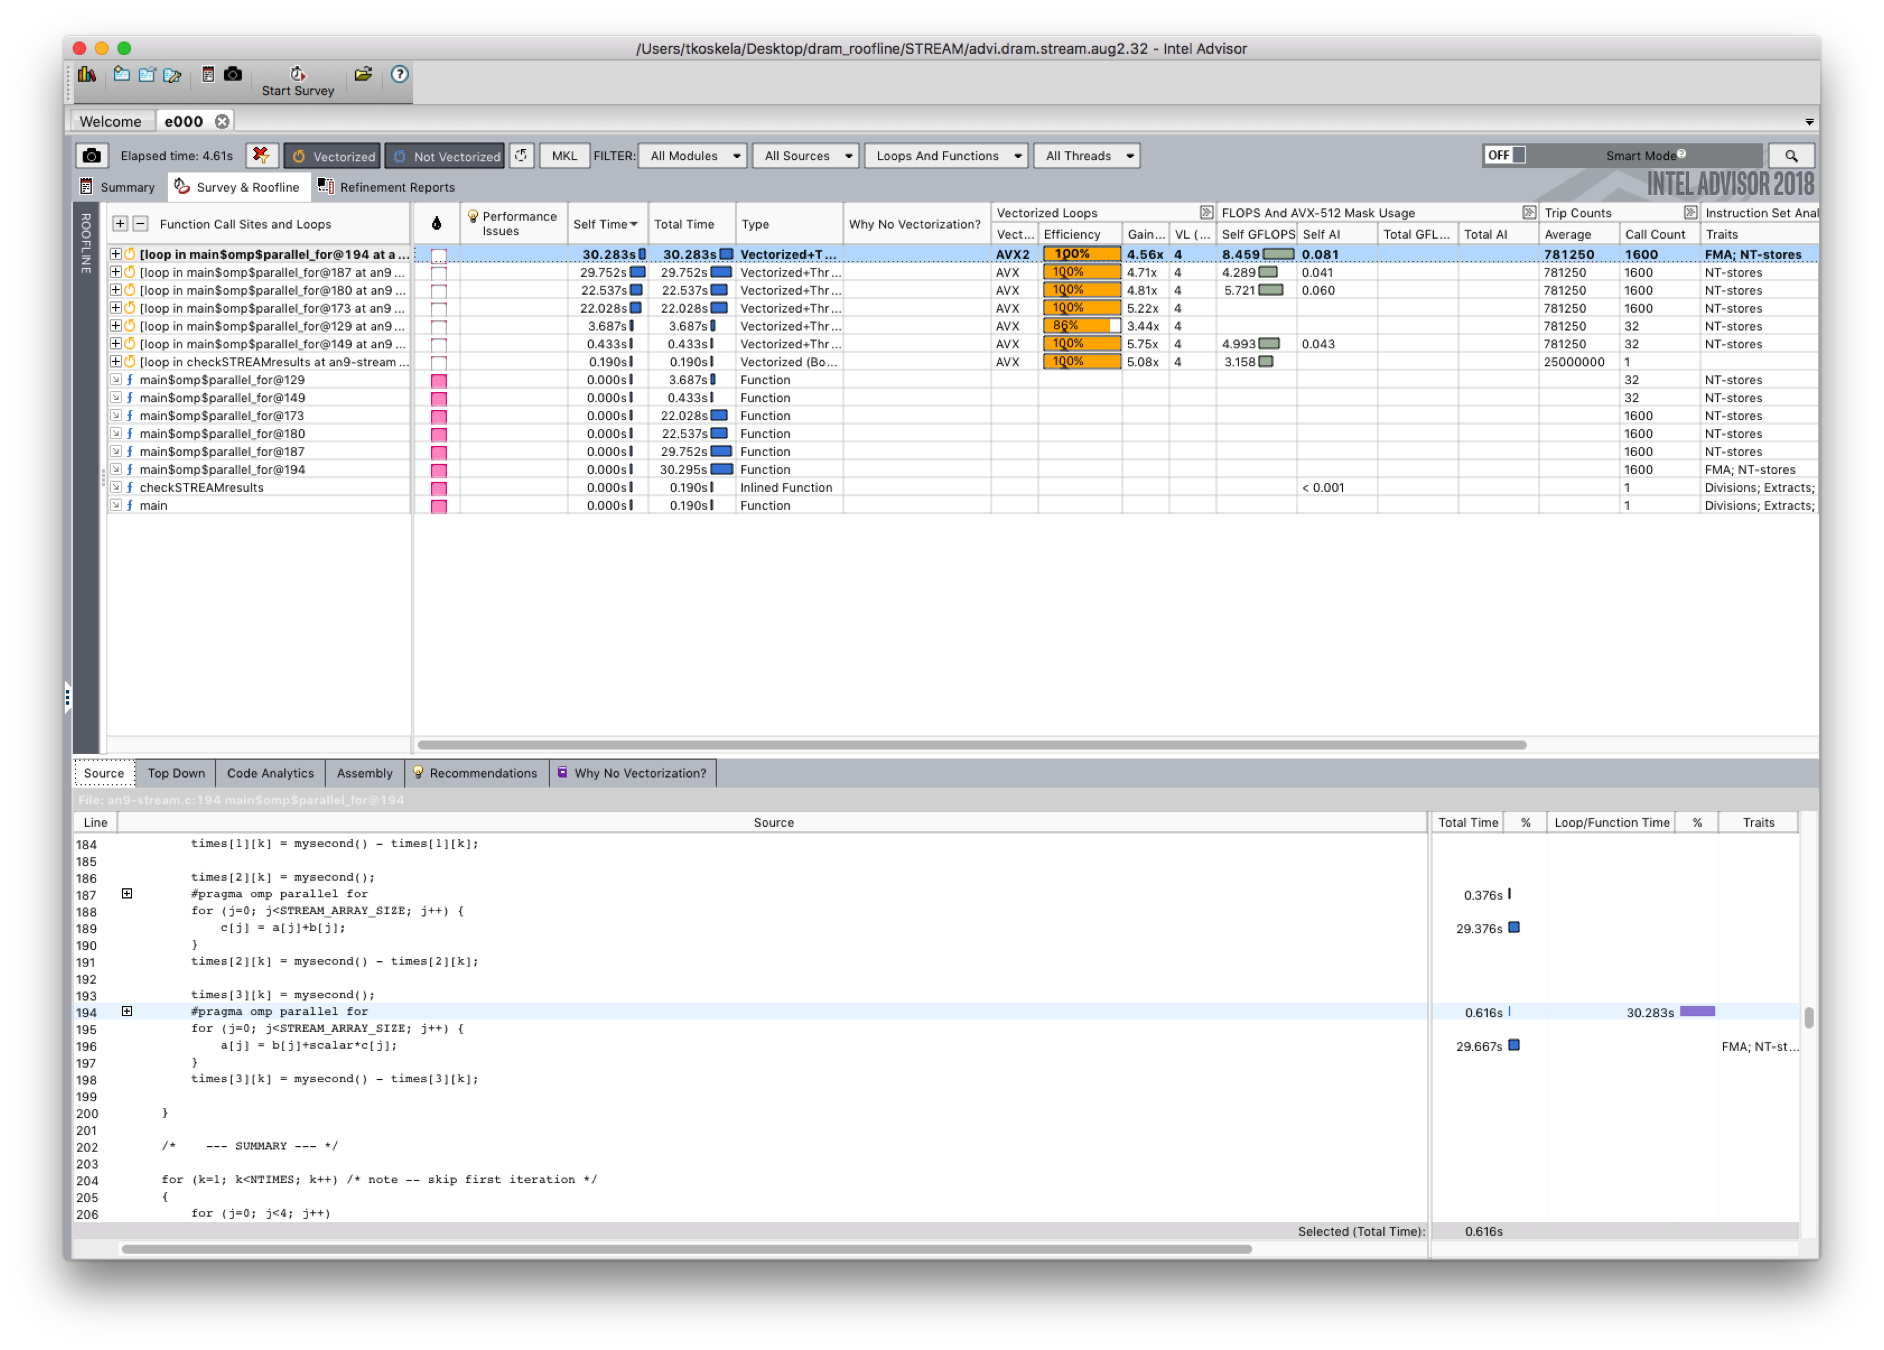
Navigate to the Survey & Roofline tab using the tabs on the top of the screen. The survey lists the loops of the application and provides information on vectorization, flop rate, arithmetic intensity, etc.
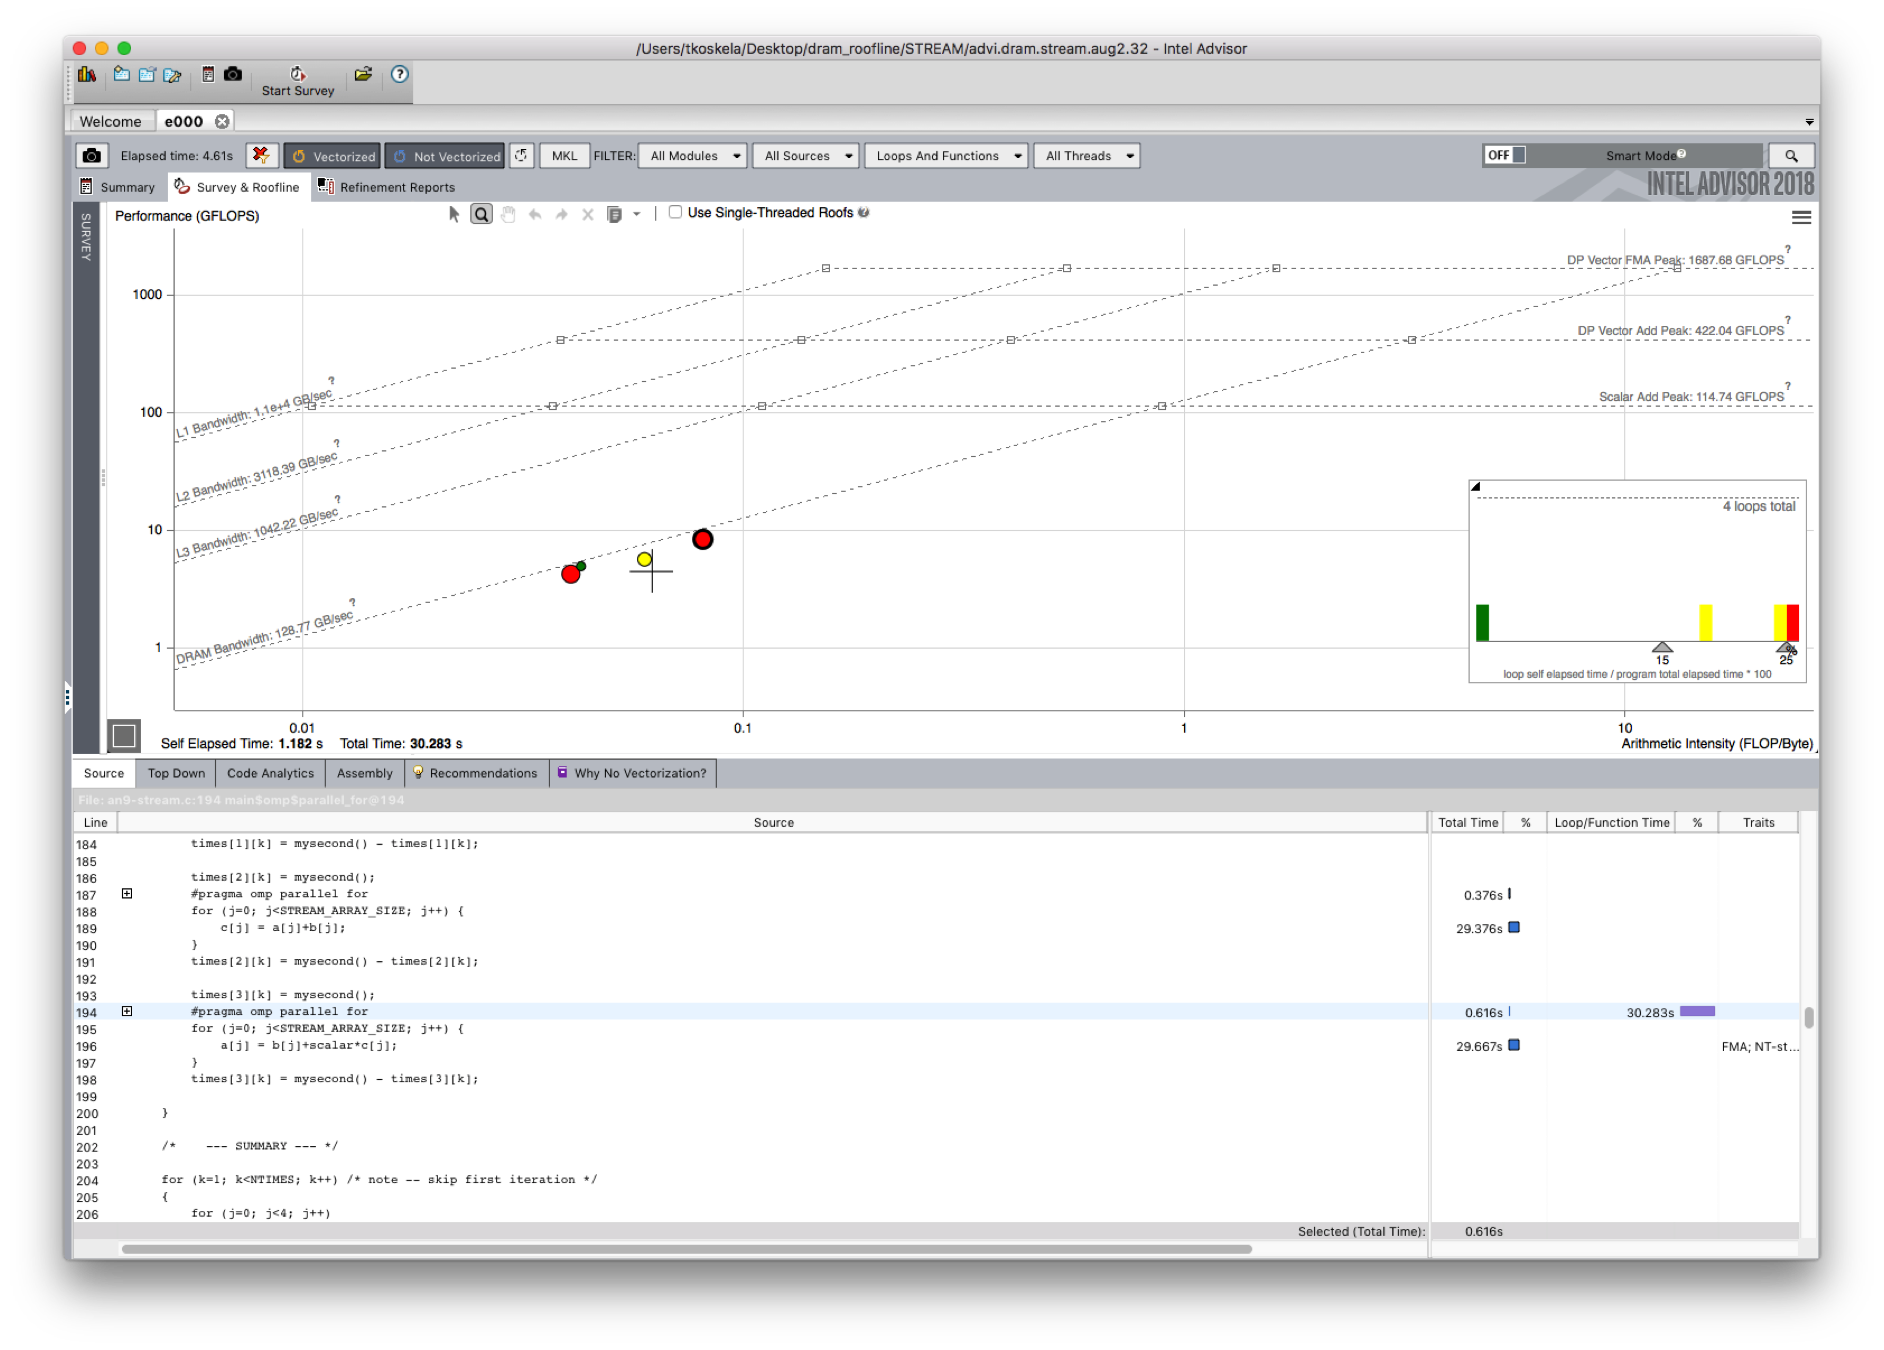
Click on the Roofline bar on the left to switch to the roofline view. This view shows the measured rooflines of the system and the loops of the application in the cache-aware roofline.
*By default, the documentation above describes how to use Intel Advisor to gather L1-roofline data (that is where the AI is defined based on L1 data traffic), you can contact NERSC consultants at consult@nersc.gov for information on experimental DRAM roofline capabilities.